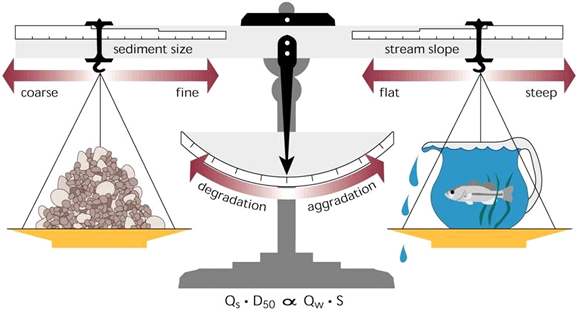
Some form of the diagram below is often used as a pedagogical tool, and to represent a theoretical framework, in fluvial geomorphology, hydrology, and river science. It is called a Lane Diagram, and originated in a publication by E.W. Lane in 1955:

The diagram shows that stream degradation (net erosion and incision) and aggradation (net deposition) responds to changes in the relationship between sediment supply (amount of sediment, Qs, and typical sediment size, D50) and sediment transport capacity (a function of discharge or flow, Qw, and slope, S). The diagram is a very helpful metaphor in understanding the sediment supply vs. transport capacity relationship, and its effects on channel aggradation or degradation.


